Address
Email address
Phone number
 https://zincpot.eeAvaleht - Zincpot
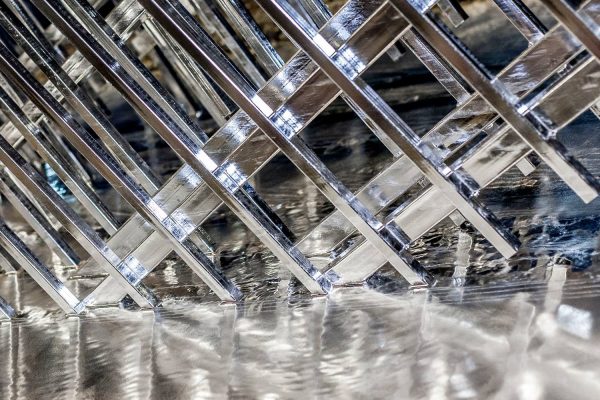
Loodud kaitsma Oleme Sinu partner metalldetailide korrosioonikindluse tõstmisel 0 + Rahulolevat klienti 0 + Aastat kogemust 0 + tonni tsingitud metalli aastas Meie teenused Paldiski Tsingipada AS on Skandinaavia ja Baltikumi suurimaid kuumtsinkimise ning Duplex (tsink + värv) teenuse pakkujaid. Kuumtsinkimine Kuni 7m pikkade detailide kuumtsinkimine kastmismeetodil vastavalt standardile ISO1461. Loe rohkem Kuumtsinkimine trumlis Väikedetailde […]
Name
AS Paldiski Tsingipada
Registry code
11309048
VAT number
EE101098225
Type
AS - Joint Stock Company
Status
Registered
Foundation date
20.10.2006 (18)
Financial year
01.01-31.12
Capital
3 140 000.00 €
Activity
46721 - Wholesale of metals and metal ores 68201 - Rental and operating of own or leased real estate 25611 - Treatment and coating of metals
-
-
-
-
-
-
-
No tax arrears
-
-
| Owner | Representative | Beneficial owner | Roles | |
|---|---|---|---|---|
| Aktsiaselts Bestnet 10261109 | 100% - 3 140 000.00 EUR | - | - | FounderShareholder |
| Jussi Ustal
| - | Board member | - | |
| Kaupo Sisask
| - | Board member | - | |
| Mikhail Kazarin
| - | - | - | Board member |
| Hans Pajoma
| - | - | - | Board member |
| Aarto Eipre
| - | - | - | Chairman of the board |
| Owner | Representative | Beneficial owner | Roles | |
|---|---|---|---|---|
| TEAM PALDISKI OÜ 14024429 | 13% - 3 750.00 EUR | - | - | Founder |
| Mittetulundusühing "Heategevusfond UUS LAINE" 80314480 | - | - | - | Founder |
| Turnover | State taxes | Labor taxes and payments | Employees | |
|---|---|---|---|---|
| 2024 Q4 | 1 468 682.45 € | 89 342.07 € | 66 585.03 € | 25 |
| 2024 Q3 | 1 258 008.34 € | 103 333.61 € | 72 518.55 € | 28 |
| 2024 Q2 | 1 386 602.9 € | 86 193.2 € | 86 102.38 € | 26 |
| 2024 Q1 | 1 347 494.1 € | 10 928.51 € | 70 770.67 € | 27 |
| 2023 Q4 | 1 597 892.1 € | 75 604.31 € | 68 886.6 € | 27 |
| 2023 Q3 | 1 407 297.46 € | 98 403.22 € | 72 109.09 € | 28 |
| 2023 Q2 | 1 529 393.88 € | 92 081.18 € | 79 994.68 € | 28 |
| 2023 Q1 | 1 354 842.2 € | 96 274.72 € | 70 064.19 € | 30 |
| 2022 Q4 | 1 515 716.38 € | 167 149.62 € | 64 397.28 € | 27 |
| 2022 Q3 | 1 439 188.13 € | 101 462.2 € | 80 978.61 € | 28 |
| 2022 Q2 | 1 695 837.98 € | 102 620.11 € | 93 363.81 € | 30 |
| 2022 Q1 | 1 348 587.52 € | 110 488.95 € | 89 063.69 € | 35 |
| 2021 Q4 | 1 565 529.95 € | 130 633.14 € | 90 676.78 € | 37 |
| 2021 Q3 | 1 463 752.04 € | 133 038.72 € | 103 655.82 € | 41 |
| 2021 Q2 | 1 540 696.81 € | 173 882.16 € | 115 207.88 € | 41 |
| 2021 Q1 | 1 143 010.91 € | 117 397.61 € | 94 667.15 € | 42 |
| 2020 Q4 | 1 503 982.39 € | 143 731 € | 93 709.75 € | 42 |
| 2020 Q3 | 1 249 865.82 € | 136 376.88 € | 95 299.06 € | 43 |
| 2020 Q2 | 1 537 036.35 € | 175 588.53 € | 112 332.75 € | 44 |
| 2020 Q1 | 1 253 172.13 € | 134 494.86 € | 100 520.69 € | 45 |


