Address
Email address
Phone number
 https://kaupmees.eeeKaupmees
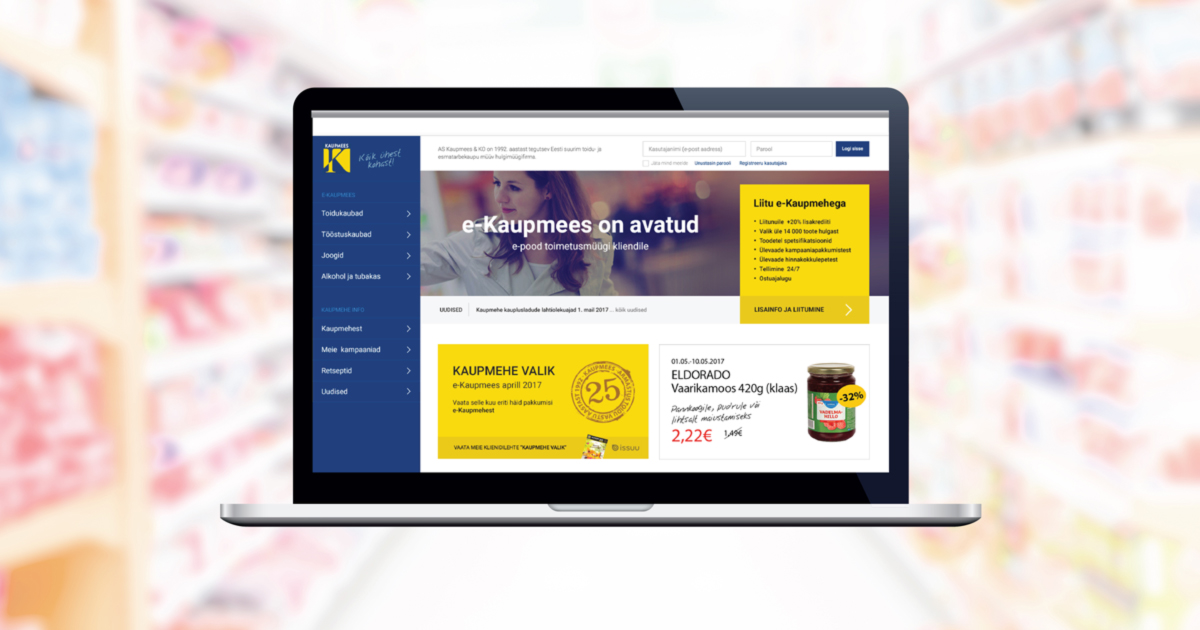
Kaupmees & KO on Eesti suurim toidukaupade ja esmatarvete hulgimüüja. 7 kauplusladu -Tallinnas, Tartus, Pärnus, Narvas, Rakveres, Jõhvis. Tellimine 24/7 eKaupmehest. Kauba kohaletoimetamine üle Eesti
Name
OÜ Bengel Invest
Registry code
11297262
VAT number
EE101079574
Type
OÜ - Limited Liability Company
Status
Registered
Foundation date
11.09.2006 (18)
Financial year
01.07-30.06
Capital
6 380.00 €
Activity
68201 - Rental and operating of own or leased real estate
-
-
-
-
-
-
-
No tax arrears
-
-
| Owner | Representative | Beneficial owner | Roles | |
|---|---|---|---|---|
| Andreas Press
| 15% - 957.00 EUR | - | - | |
| Argo Aasjõe
| 15% - 957.00 EUR | - | - | |
| Allar Aasjõe
| 15% - 957.00 EUR | - | - | |
| Oliver Press
| 15% - 957.00 EUR | - | - | |
| Margus Press
| 20% - 1 276.00 EUR | Board member | - | |
| OSAÜHING ALTO 10782328 | 20% - 1 276.00 EUR | - | - | Founder |
| Alar Aasjõe
| - | Board member | - | |
| Osaühing P.J.V. Investeeringud 10671511 | - | - | - | Founder |
| Owner | Representative | Beneficial owner | Roles | |
|---|---|---|---|---|
| TeBen OÜ 16202131 | 50% - 1 250.00 EUR | - | - | Founder |
| Turnover | State taxes | Labor taxes and payments | Employees | |
|---|---|---|---|---|
| 2024 Q4 | 203 993.33 € | 32 159.54 € | 957.6 € | 1 |
| 2024 Q3 | 199 423.42 € | 32 000.2 € | 957.6 € | 1 |
| 2024 Q2 | 202 914.55 € | 41 956.56 € | 3 302.95 € | 1 |
| 2024 Q1 | 209 390.74 € | 31 120.81 € | 1 415.88 € | 1 |
| 2023 Q4 | 199 248.35 € | 29 538.99 € | 912 € | 1 |
| 2023 Q3 | 185 104.41 € | 29 142.45 € | 912 € | 1 |
| 2023 Q2 | 186 953.22 € | 41 378.1 € | 2 107.6 € | 1 |
| 2023 Q1 | 190 364.89 € | 24 241.11 € | 868.56 € | 1 |
| 2022 Q4 | 172 639.73 € | 27 915.11 € | 1 158.08 € | 1 |
| 2022 Q3 | 165 865.94 € | 37 903.32 € | 868.56 € | 1 |
| 2022 Q2 | 170 377.43 € | 25 625.84 € | 868.56 € | 1 |
| 2022 Q1 | 176 391.22 € | 22 951 € | 862.44 € | 1 |
| 2021 Q4 | 159 413.41 € | - | 2 233.08 € | 1 |
| 2021 Q3 | 138 721.72 € | - | 1 193.19 € | 2 |
| 2021 Q2 | 317 480.38 € | - | 1 193.19 € | 2 |
| 2021 Q1 | 150 946.95 € | 22 810.07 € | 1 327.69 € | 2 |
| 2020 Q4 | 139 183.22 € | 19 018.44 € | 1 193.19 € | 2 |
| 2020 Q3 | 133 460.86 € | 22 338.18 € | 1 160.04 € | 2 |
| 2020 Q2 | 130 033.2 € | 19 909.49 € | 1 160.04 € | 2 |
| 2020 Q1 | 138 099.92 € | 22 185.37 € | 1 294.54 € | 2 |


