Address
Email address
Phone number
Website
 https://www.alunaut.eeHigh Quality Aluminum Boats - Alunaut
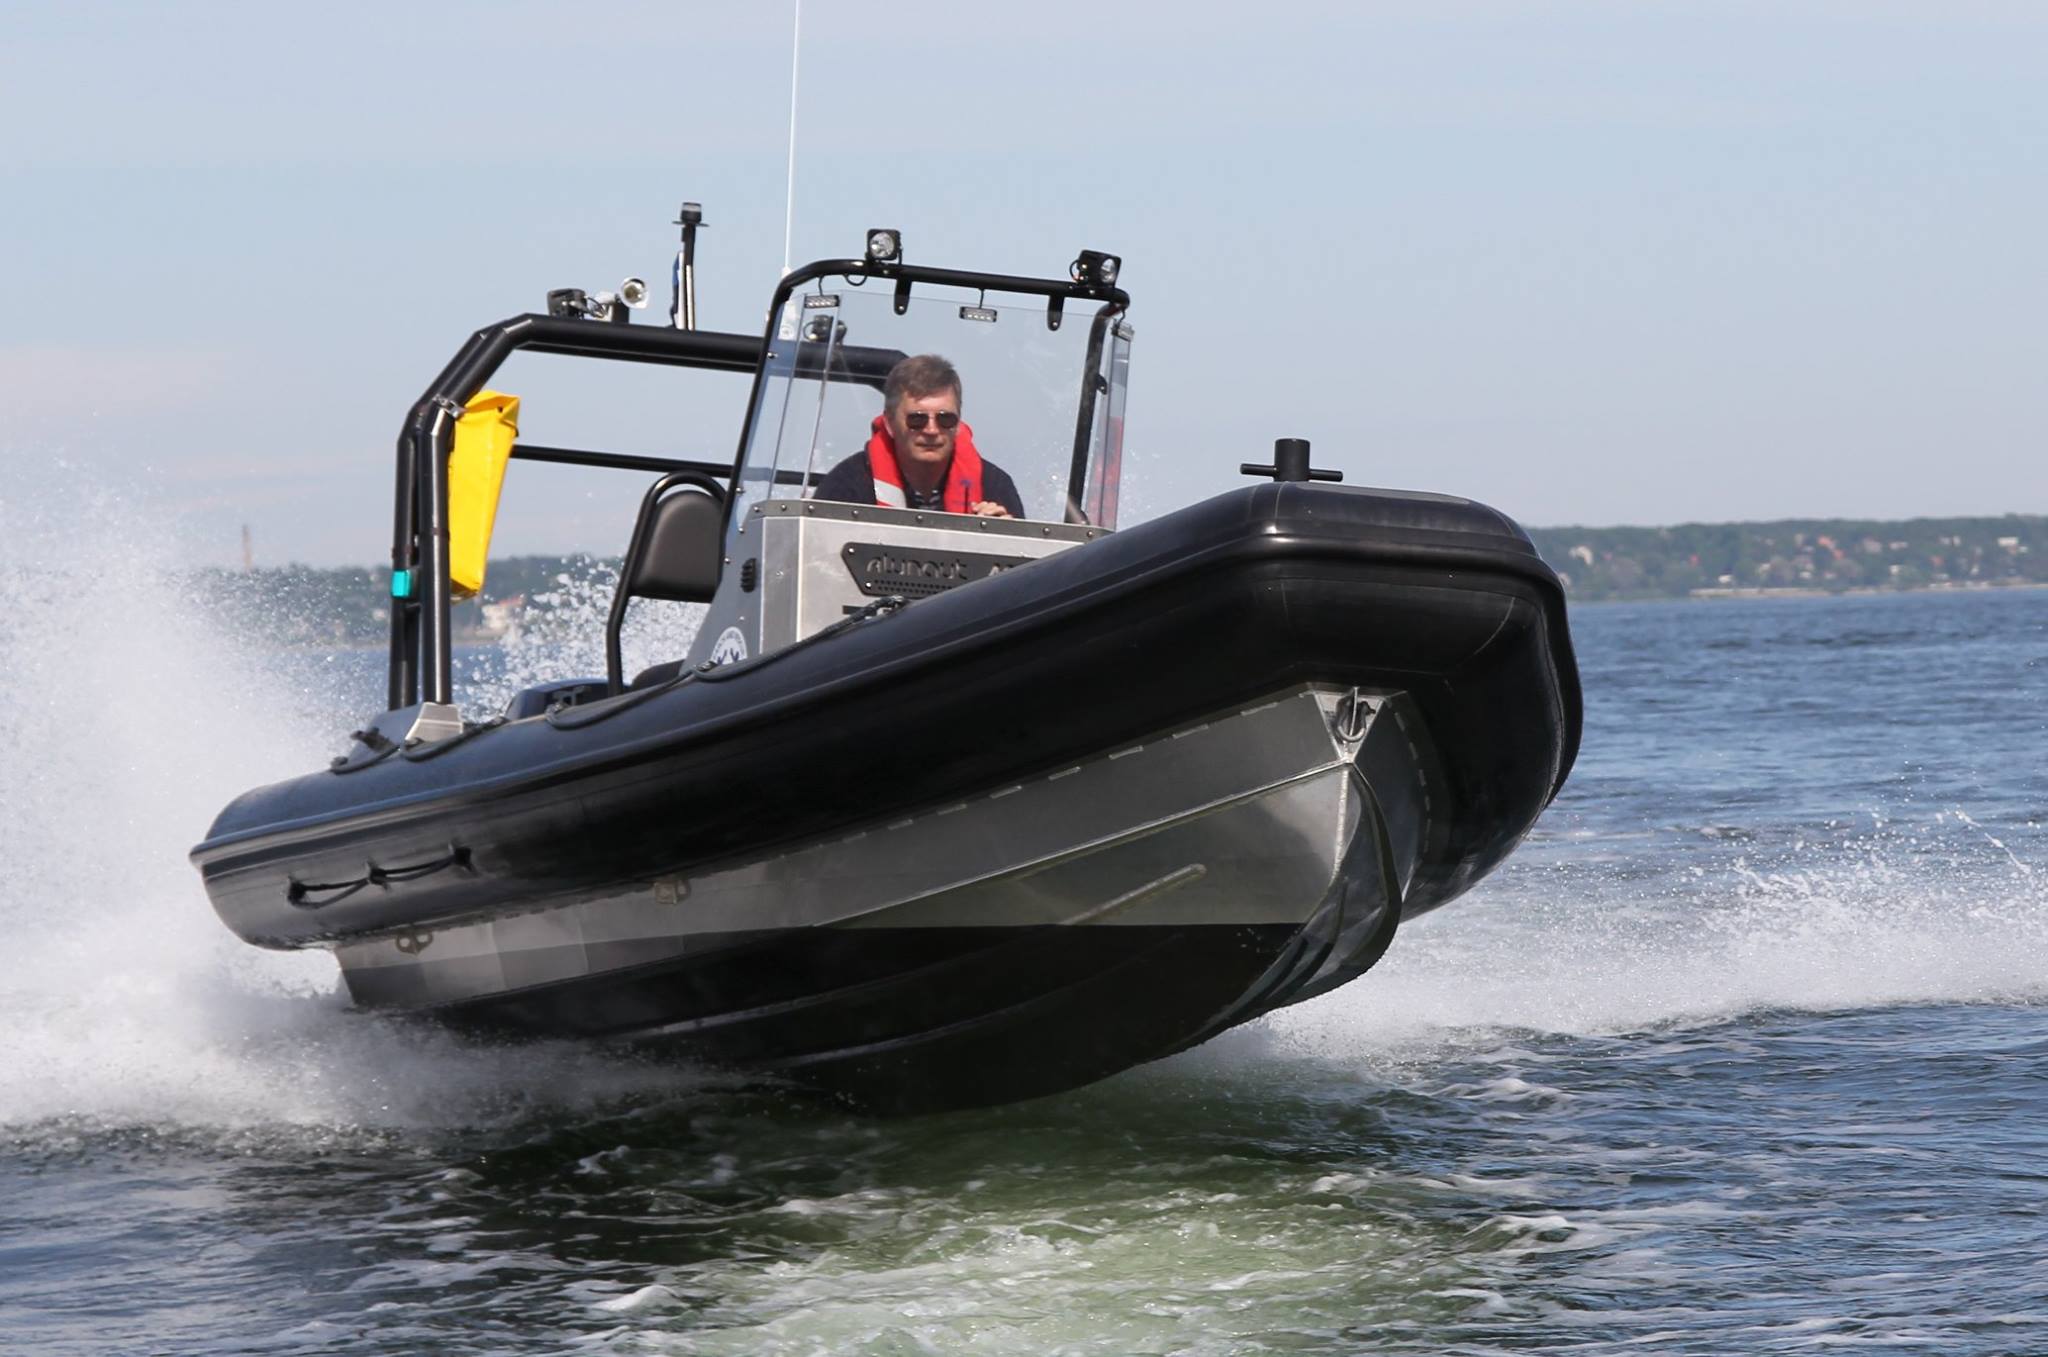
High Quality Aluminum Boats and on time delivery of production is secured by skilled staff for best satisfaction of our customers worldwide.
Name
Alunaut OÜ
Registry code
10052015
VAT number
EE100486074
Type
OÜ - Limited Liability Company
Status
Registered
Foundation date
21.06.1996 (28)
Financial year
01.01-31.12
Capital
22 600.00 €
Activity
33151 - Repair and maintenance of ships and boats 25621 - Machining 46771 - Wholesale of waste and scrap, buying up packaging and tare 47991 - Other retail sale not in stores, stalls or markets 25119 - Manufacture of other metal structures and parts of structures 30111 - Building of ships 30121 - Building of pleasure and sporting boats 45191 - Sale of other motor vehicles 46901 - Non-specialised wholesale trade
-
-
-
-
-
-
-
No tax arrears
-
-
| Owner | Representative | Beneficial owner | Roles | |
|---|---|---|---|---|
| Reimo Võting
| 26% - 5 876.00 EUR | - | - | |
| TT Holding OÜ 11524775 | 24% - 5 424.00 EUR | - | - | |
| Mark Muru
| 17% - 3 842.00 EUR | Board member | - | Founder |
| Merle Muru
| 15% - 3 390.00 EUR | Board member | - | |
| Margo Karu
| 13% - 2 938.00 EUR | - | - | |
| Omar Neiland
| 5% - 1 130.00 EUR | - | - | |
| Viktor Palmet
| - | - | - | Founder |
| Turnover | State taxes | Labor taxes and payments | Employees | |
|---|---|---|---|---|
| 2024 Q4 | 648 010.22 € | 72 474.74 € | 76 831.9 € | 20 |
| 2024 Q3 | 455 077.7 € | 52 661.53 € | 57 380.49 € | 20 |
| 2024 Q2 | 1 265 989.04 € | 68 348.88 € | 73 019.05 € | 21 |
| 2024 Q1 | 1 189 803.85 € | 69 737.47 € | 67 889.03 € | 24 |
| 2023 Q4 | 1 834 905.8 € | 71 399.58 € | 66 974.07 € | 24 |
| 2023 Q3 | 289 513.2 € | 59 044.9 € | 63 449.08 € | 22 |
| 2023 Q2 | 1 731 839.2 € | 56 031.72 € | 60 132.92 € | 21 |
| 2023 Q1 | 227 872.78 € | 61 214.68 € | 65 153.09 € | 20 |
| 2022 Q4 | 1 411 877.81 € | 5 107.57 € | 50 581.96 € | 19 |
| 2022 Q3 | 241 435.57 € | 39 938.53 € | 43 722.72 € | 18 |
| 2022 Q2 | 430 573.48 € | 53 004.56 € | 56 812.74 € | 21 |
| 2022 Q1 | 743 683.2 € | 50 996.46 € | 54 210.13 € | 21 |
| 2021 Q4 | 130 482.32 € | 46 252.37 € | 47 745.29 € | 18 |
| 2021 Q3 | 144 555.62 € | 38 321.09 € | 42 372.73 € | 17 |
| 2021 Q2 | 375 368.8 € | 83 302.03 € | 58 282.85 € | 17 |
| 2021 Q1 | 113 651.78 € | 50 561.2 € | 47 816.33 € | 15 |
| 2020 Q4 | 105 902.61 € | 40 127.23 € | 28 870.66 € | 16 |
| 2020 Q3 | 386 961.36 € | 49 993.88 € | 52 008.51 € | 17 |
| 2020 Q2 | 574 199.01 € | 42 372.44 € | 45 664.46 € | 19 |
| 2020 Q1 | 2 677 071.43 € | 51 396.64 € | 55 404.02 € | 19 |