Address
Email address
Phone number
Website
 https://www.lincona.eePõrandakatted | Lincona
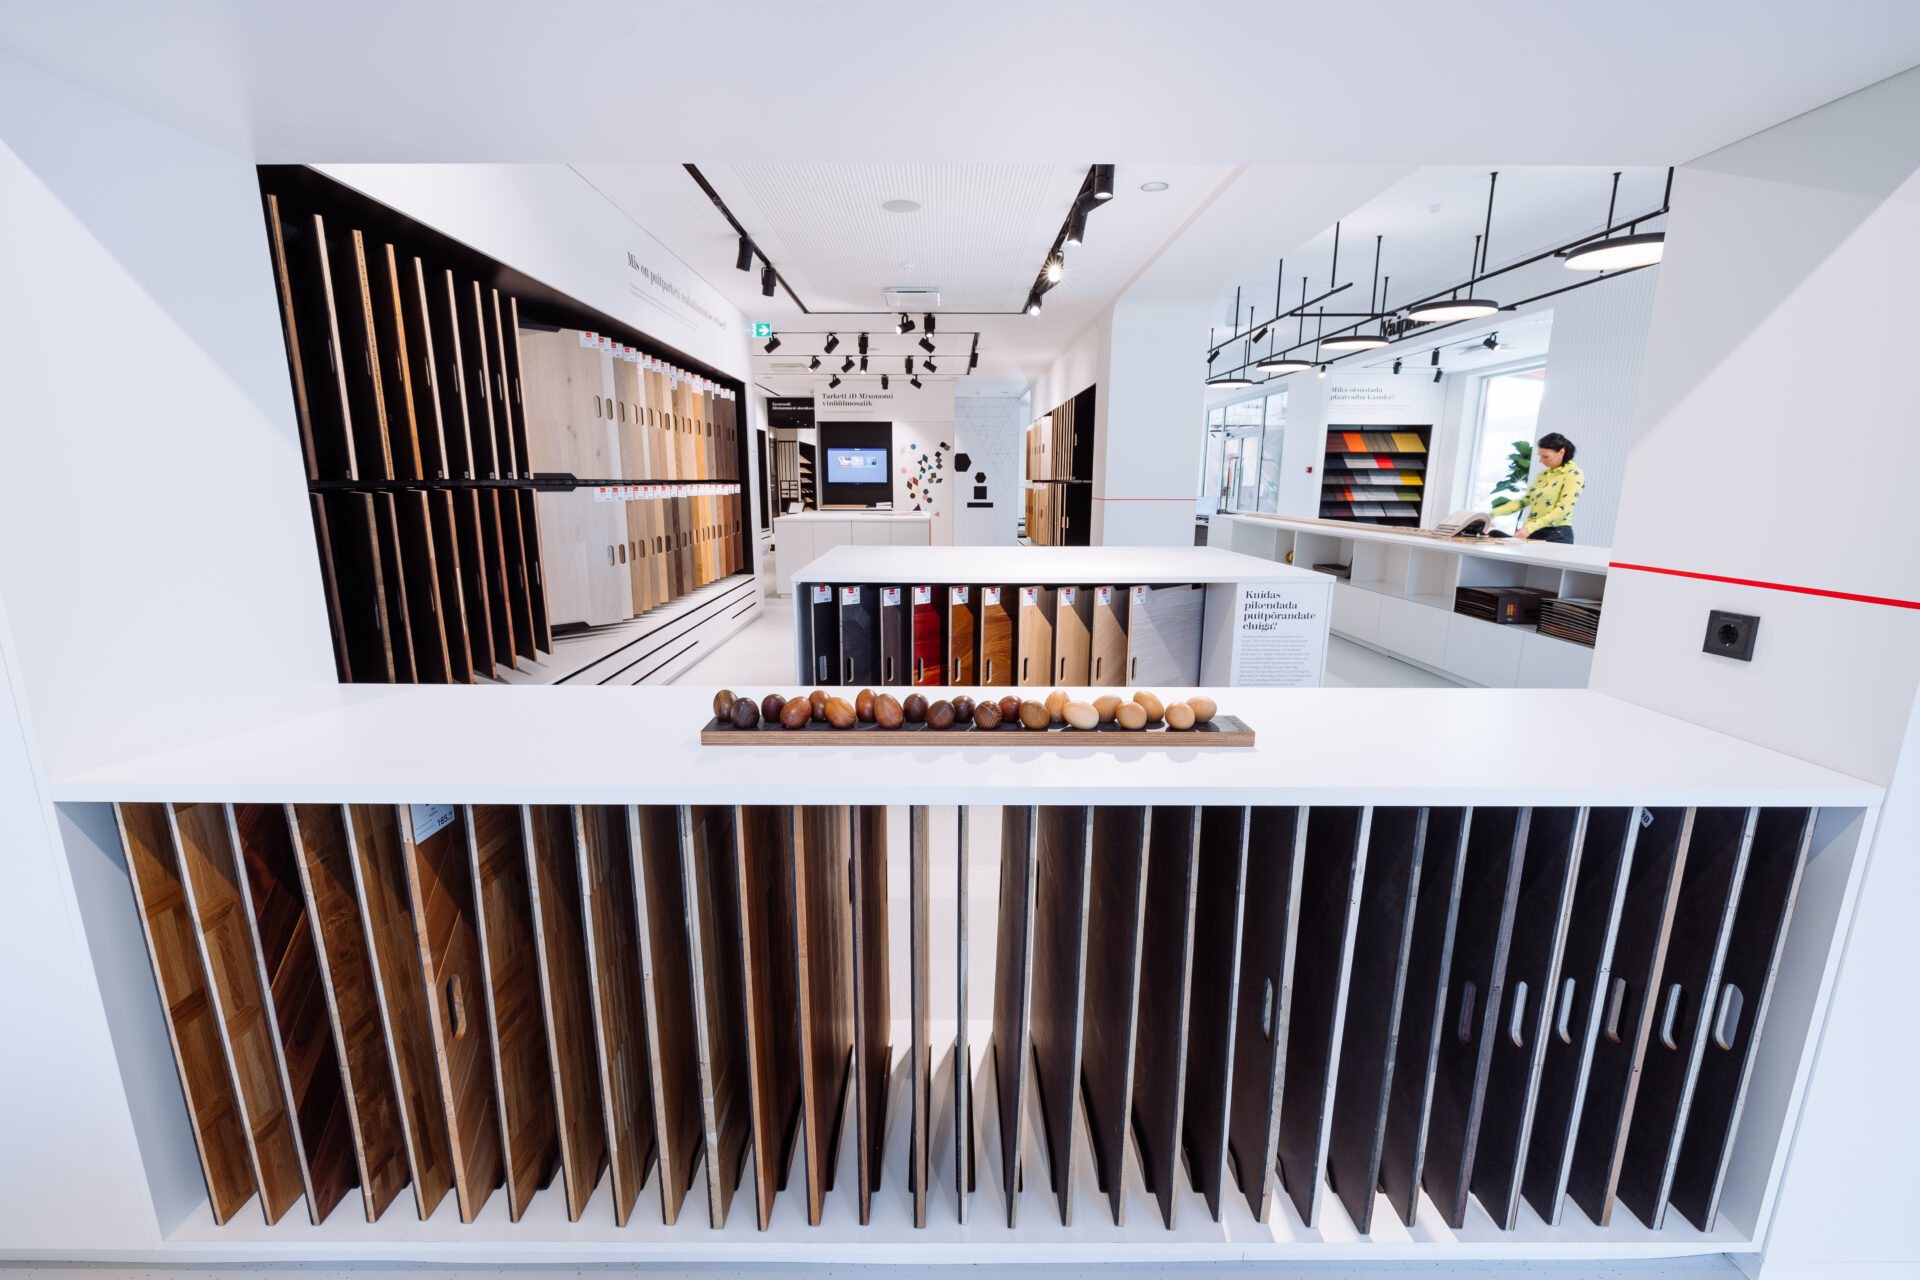
Lincona on Eesti suurim põrandakatete maaletooja ja müüja. Saa esimesena teada uudistoodetest, sooduspakkumistest ja põrandanippidest.
Name
Aktsiaselts Lincona Konsult
Registry code
10011281
VAT number
EE100263802
Type
AS - Joint Stock Company
Status
Registered
Foundation date
21.02.1996 (29)
Financial year
01.01-31.12
Capital
62 622.00 €
Activity
96099 - Other service activities 43331 - Floor and wall covering 49411 - Freight transport by road 47531 - Retail sale of carpets, rugs, wall and floor coverings in specialised stores 52101 - Operation of storage and warehouse facilities 68201 - Rental and operating of own or leased real estate 77321 - Rental and leasing of construction and civil engineering machinery and equipment 46732 - Wholesale of sanitary equipment and other construction materials
-
-
-
-
-
-
-
No tax arrears
-
-
| Owner | Representative | Beneficial owner | Roles | |
|---|---|---|---|---|
| Anna-Maria Tuisk-Küün
| 15% - 9 393.30 EUR | Board member | - | Shareholder |
| OÜ Pädaste Sadam 11084508 | 65% - 40 704.30 EUR | - | - | Shareholder |
| Sven Ersling
| 20% - 12 524.40 EUR | Board member | - | Shareholder |
| Hannes Küün
| - | - | - | Board member |
| Olavi Tuisk
| - | - | - | Board member |
| Tiiu Tuisk
| - | - | - | Chairman of the board |
| Owner | Representative | Beneficial owner | Roles | |
|---|---|---|---|---|
| Viimistlusmaterjalide Paigaldajate ja Tarnijate Liit 80573566 | - | - | - | Founder (without contribution) |
| Turnover | State taxes | Labor taxes and payments | Employees | |
|---|---|---|---|---|
| 2024 Q4 | 8 727 464.89 € | 1 158 721.17 € | 269 070.68 € | 60 |
| 2024 Q3 | 8 102 778.97 € | 1 110 707.86 € | 282 039.17 € | 60 |
| 2024 Q2 | 8 375 254.26 € | 1 250 566.09 € | 275 733.41 € | 59 |
| 2024 Q1 | 7 054 037.65 € | 997 123.75 € | 281 475.02 € | 62 |
| 2023 Q4 | 6 554 278.57 € | 928 154.24 € | 267 833.12 € | 60 |
| 2023 Q3 | 8 470 562.47 € | 1 269 611.5 € | 286 289.58 € | 59 |
| 2023 Q2 | 9 998 831.57 € | 1 506 445.52 € | 260 792.36 € | 57 |
| 2023 Q1 | 8 738 871.8 € | 1 221 966.06 € | 309 187.59 € | 60 |
| 2022 Q4 | 10 238 743.06 € | 1 139 457.92 € | 256 817.45 € | 58 |
| 2022 Q3 | 9 999 943.13 € | 1 418 474.88 € | 296 880.15 € | 59 |
| 2022 Q2 | 11 967 560.29 € | 1 375 933.67 € | 264 961.1 € | 62 |
| 2022 Q1 | 8 975 665.87 € | 1 131 266.51 € | 292 919.96 € | 63 |
| 2021 Q4 | 8 569 627.59 € | 1 004 863.68 € | 227 696.93 € | 62 |
| 2021 Q3 | 8 057 493.77 € | 1 082 866.08 € | 238 442.08 € | 62 |
| 2021 Q2 | 7 540 569.48 € | 916 336.34 € | 211 590.32 € | 60 |
| 2021 Q1 | 6 201 419.68 € | 855 052.06 € | 238 746.13 € | 62 |
| 2020 Q4 | 5 892 228.31 € | 799 480.71 € | 210 051.81 € | 62 |
| 2020 Q3 | 7 541 302.52 € | 1 006 206.02 € | 235 446.55 € | 60 |
| 2020 Q2 | 7 561 371.91 € | 949 224.19 € | 211 554.84 € | 61 |
| 2020 Q1 | 7 194 555.98 € | 929 854.15 € | 245 700.02 € | 60 |