Address
Email address
Phone number
Website
 https://www.viiking.eeViiking Spaa Hotell Pärnus | Pärnu spa | Ametlik koduleht
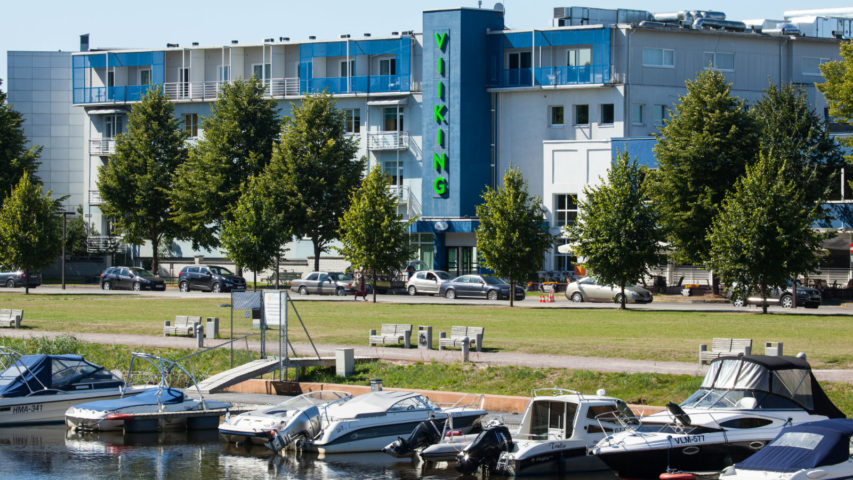
Viiking Spaa Hotell Pärnu rannarajoonis avas 2015 uue veekeskuse „Viiking Saaga“. Eesti ainus ravispaa pakub lisaks ka tervisuuringuid.
Name
Aktsiaselts Taastusravikeskus Viiking
Registry code
10002098
VAT number
EE100118290
Type
AS - Joint Stock Company
Status
Registered
Foundation date
09.11.1995 (29)
Financial year
01.01-31.12
Capital
440 979.00 €
Activity
96041 - Activities of saunas, sunbeds and massage salons and other services related to physical well-being 4711 - Retail sale in non-specialised stores with food, beverages or tobacco predominating 86905 - Activities of sanatoriums 56101 - Restaurants, cafeterias and other catering places 55101 - Hotels 96021 - Hairdressing and other beauty treatment
-
-
-
-
-
-
-
No tax arrears
-
-
| Owner | Representative | Beneficial owner | Roles | |
|---|---|---|---|---|
| osaühing Tekali 10059483 | 100% - 440 979.00 EUR | - | - | Shareholder |
| Toivo Ninnas
| - | Board member | - | |
| Tarmo Niinas
| - | - | - | Board member |
| Svetlana Ninnas
| - | - | - | Board member |
| Stella Ninnas
| - | - | - | Board member |
| Toivo Ninnas
| - | - | - | Board member |
| Owner | Representative | Beneficial owner | Roles | |
|---|---|---|---|---|
| osaühing Viikingi Külalissadam 11030895 | 100% - 40 200.00 EEK | - | - |
| Turnover | State taxes | Labor taxes and payments | Employees | |
|---|---|---|---|---|
| 2024 Q4 | 1 328 743.42 € | 206 830.8 € | 165 598.04 € | 125 |
| 2024 Q3 | 1 823 979.25 € | 264 174.11 € | 171 909.74 € | 112 |
| 2024 Q2 | 1 283 939.03 € | 193 819.23 € | 168 467.11 € | 131 |
| 2024 Q1 | 1 051 403.12 € | 181 674.59 € | 178 665.72 € | 117 |
| 2023 Q4 | 1 341 204.6 € | 328 010.74 € | 158 886.91 € | 129 |
| 2023 Q3 | 1 868 327.66 € | 282 247.41 € | 190 554.87 € | 109 |
| 2023 Q2 | 1 236 329.32 € | 164 139.4 € | 145 390.8 € | 115 |
| 2023 Q1 | 994 337.03 € | 153 364.78 € | 158 485.69 € | 112 |
| 2022 Q4 | 1 302 253.68 € | 166 362.06 € | 136 261.79 € | 119 |
| 2022 Q3 | 1 713 630.27 € | 204 620.16 € | 138 151.31 € | 116 |
| 2022 Q2 | 1 167 295.53 € | 127 204.44 € | 111 028.27 € | 128 |
| 2022 Q1 | 671 281.63 € | 111 258.87 € | 116 683.16 € | 112 |
| 2021 Q4 | 836 190.68 € | 134 355.3 € | 109 065.03 € | 114 |
| 2021 Q3 | 1 278 195.58 € | 157 847.14 € | 92 237.09 € | 99 |
| 2021 Q2 | 40 563.54 € | 33 307.81 € | 36 453.48 € | 97 |
| 2021 Q1 | 476 427.19 € | 96 725.85 € | 103 014.27 € | 65 |
| 2020 Q4 | 697 068.43 € | 127 774.79 € | 106 451.17 € | 78 |
| 2020 Q3 | 1 139 902.83 € | 146 190.03 € | 92 126.96 € | 86 |
| 2020 Q2 | 149 240.8 € | 80 134.4 € | 87 206.38 € | 113 |
| 2020 Q1 | 977 731.28 € | 172 084.9 € | 177 458.91 € | 99 |